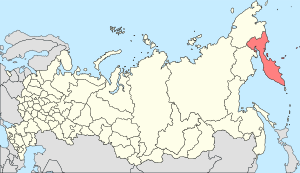
Kamchatka Krai (Russian: Камча́тский край) is a federal subject of Russia (a krai). It was formed on July 1, 2007 as a result of the merger of Kamchatka Oblast and Koryak Autonomous Okrug, after a referendum was held on the issue on October 23, 2005. The krai's administrative center is the city of Petropavlovsk-Kamchatsky. The okrug retains the status of a special administrative division of the krai under the name of Koryak Okrug.
Contents[hide] |
[edit] Administrative divisions
[edit] Demographics
- Births (2008 Jan-Nov): 3,673 (11.55 per 1000)
- Deaths (2008 Jan-Nov): 3,554 (11.17 per 1000)[12]
[edit] Vital statistics for 2007
Source:[13]
- Births: 3,931 (11.32 per 1000, 11.36 for urban areas & 11.20 for rural areas).
- Deaths: 3,863 (11.13 per 1000, 10.49 for urban areas & 13.63 for rural areas).
- Natural Growth Rate: +0.02% per year (+0.09% for urban areas & -0.24% for rural areas).
After nearly two decades, Kamchatka recorded a net natural population growth instead of decline in 2007. However in first half of 2008, the trend was reversed and population decline was observed again, partly due to an increased mortality rate among the rural population.
[edit] Ethnic composition-(copy of wikipedia)
| This article needs additional citations for verification. Please help improve this article by adding reliable references. Unsourced material may be challenged and removed. (February 2011) |
According to the 2002 Census, out of those who stated their nationality in Census, around 91.85% of the population is White or European (i.e. Slavic, Germanic, Finnic, Mordvin, Moldvin or Romanian and Greek), while close to 4.46% is indigenous (Mostly the Koryak) but a few Itelmen and Chukchi descendants. "Kamchadal" is a common nickname for inhabitants of Kamchatka, shown a more progressive trend in politics and a higher standard of living than most of Russia except Moscow.
Historically, Kamchatka is relatively small, young and most Russian settlement occurred in the late 18th and 19th centuries. The seaport cities attracted a fairly small number of Western European settlers, notably British, Dutch, French, Italians, Scandinavians and from the United States (or Americans). They tend to stay shortly or forced out by Soviet authorities after taking over in 1917 to its' collapse by late 1991, or their descendants had assimilated, by conversion into the Russian Orthodox Church.
A small number of Russian speaking Cossacks and other nationalities such as Kazakhs, Chechens, Ukrainians, "Polonians" or Poles and ethnic Russian Jews, boycotted the census, refusing to state their nationality. In Kamchatka close to 3.3% refused to state their nationality. Some non-European descendants such as Aleuts from Alaska in North America and Koreans live in Kamchatka. There were cultural connections being revived in post-Soviet times with the west, esp. Britain; the Americas; East Asia and the Pacific islands with that of Russified Kamchatka.
| Ethnic Group | Pop | Percent |
|---|---|---|
| Total population | 358,801 | 100.00% |
| Total White | 318,943 | 88.89% |
| Russians | 290,108 | 80.85% |
| Ukrainians | 20,870 | 5.82% |
| Belarusians | 3,489 | 0.97% |
| Mordivians | 1,170 | 0.33% |
| Germans | 707 | 0.20% |
| Moldavians | 662 | 0.18% |
| Udmurts | 503 | 0.14% |
| Other White | 1,434 | 0.40% |
| Total Tribal | 15,497 | 4.32% |
| Koryaks | 7,328 | 2.04% |
| Itelmens | 2,296 | 0.64% |
| Kamchadals | 1,881 | 0.52% |
| Evens | 1,779 | 0.50% |
| Chukchis | 1,487 | 0.41% |
| Aleuts | 446 | 0.12% |
| Other Tribal | 280 | 0.08% |
| Total Turkic/Caucassian/Asian | 12,673 | 3.53% |
| Tatars | 3,617 | 1.01% |
| Koreans | 1,749 | 0.49% |
| Azerbaijanians | 1,311 | 0.37% |
| Chuvash | 1,292 | 0.36% |
| Armenians | 948 | 0.26% |
| Bashkirs | 575 | 0.16% |
| Other Asian | 3,181 | 0.89% |
| Not Stated | 11,602 | 3.23% |
| Other | 86 | 0.02% |


No comments:
Post a Comment